
Emporium – Human Capital Analytics
Freelance
Background
Emporium is a platform designed to assist Human Resources (HR) teams in managing employee data and gaining actionable insights. It provides tools to analyze key HR metrics such as employee performance, turnover rates, and workforce demographics—supporting better decision-making for state-owned enterprises (BUMN).
Freelance project focused on human capital analytics for Indonesian state-owned enterprises (BUMN)
Solution
Developed a comprehensive Human Capital Analytics Dashboard featuring pixel-perfect implementation from Figma designs, dynamic Highcharts visualizations, and seamless backend integration for real-time data insights.
Dynamic Data Visualization
Interactive pie, column, spline, and bar charts using Highcharts for comprehensive data analysis
Advanced Search & Filter
Complex filtering system with up to 10 filters including gender, education, and division parameters
Real-time Integration
Seamless backend integration for live data updates and actionable workforce insights
Data Export Features
Admin functionality to download datasets across dashboards for enhanced accessibility
Implementation
Built with Bootstrap for responsive UI, jQuery for interactivity, and Highcharts for advanced data visualization. Integrated with backend APIs for real-time data access.
Technical Challenge
Working with Highcharts for the first time required extensive documentation study to implement and customize charts effectively. Building a complex search filter system with up to 10 filters (gender, education, division) while ensuring seamless interaction and accurate data filtering posed significant technical challenges.
Post-Launch Enhancements
After launch, several bugs and feature improvements were addressed over a two-month period to enhance user experience and system functionality.
Analytics Search System
Implemented search functionality in analytics use cases menu, extending capabilities beyond management dashboard and reporting for improved data discovery.
Advanced Filtering
Added comprehensive filters in the Demografia section to align with other dashboard functionalities and provide consistent user experience.
Dataset Download
Enabled admin users to download datasets across dashboards, enhancing data accessibility and supporting offline analysis workflows.
Automatic Data Integration
Integrated with 3rd party internal company API to auto-populate user details including NIK, name, position, and organizational unit.
Pagination & Sorting
Implemented pagination and sorting functionality in admin menus to improve navigation and usability when handling large datasets.
Dashboard Screenshots
⚠️ Note: All data shown in these screenshots are dummy data for demonstration purposes and do not represent real company information.
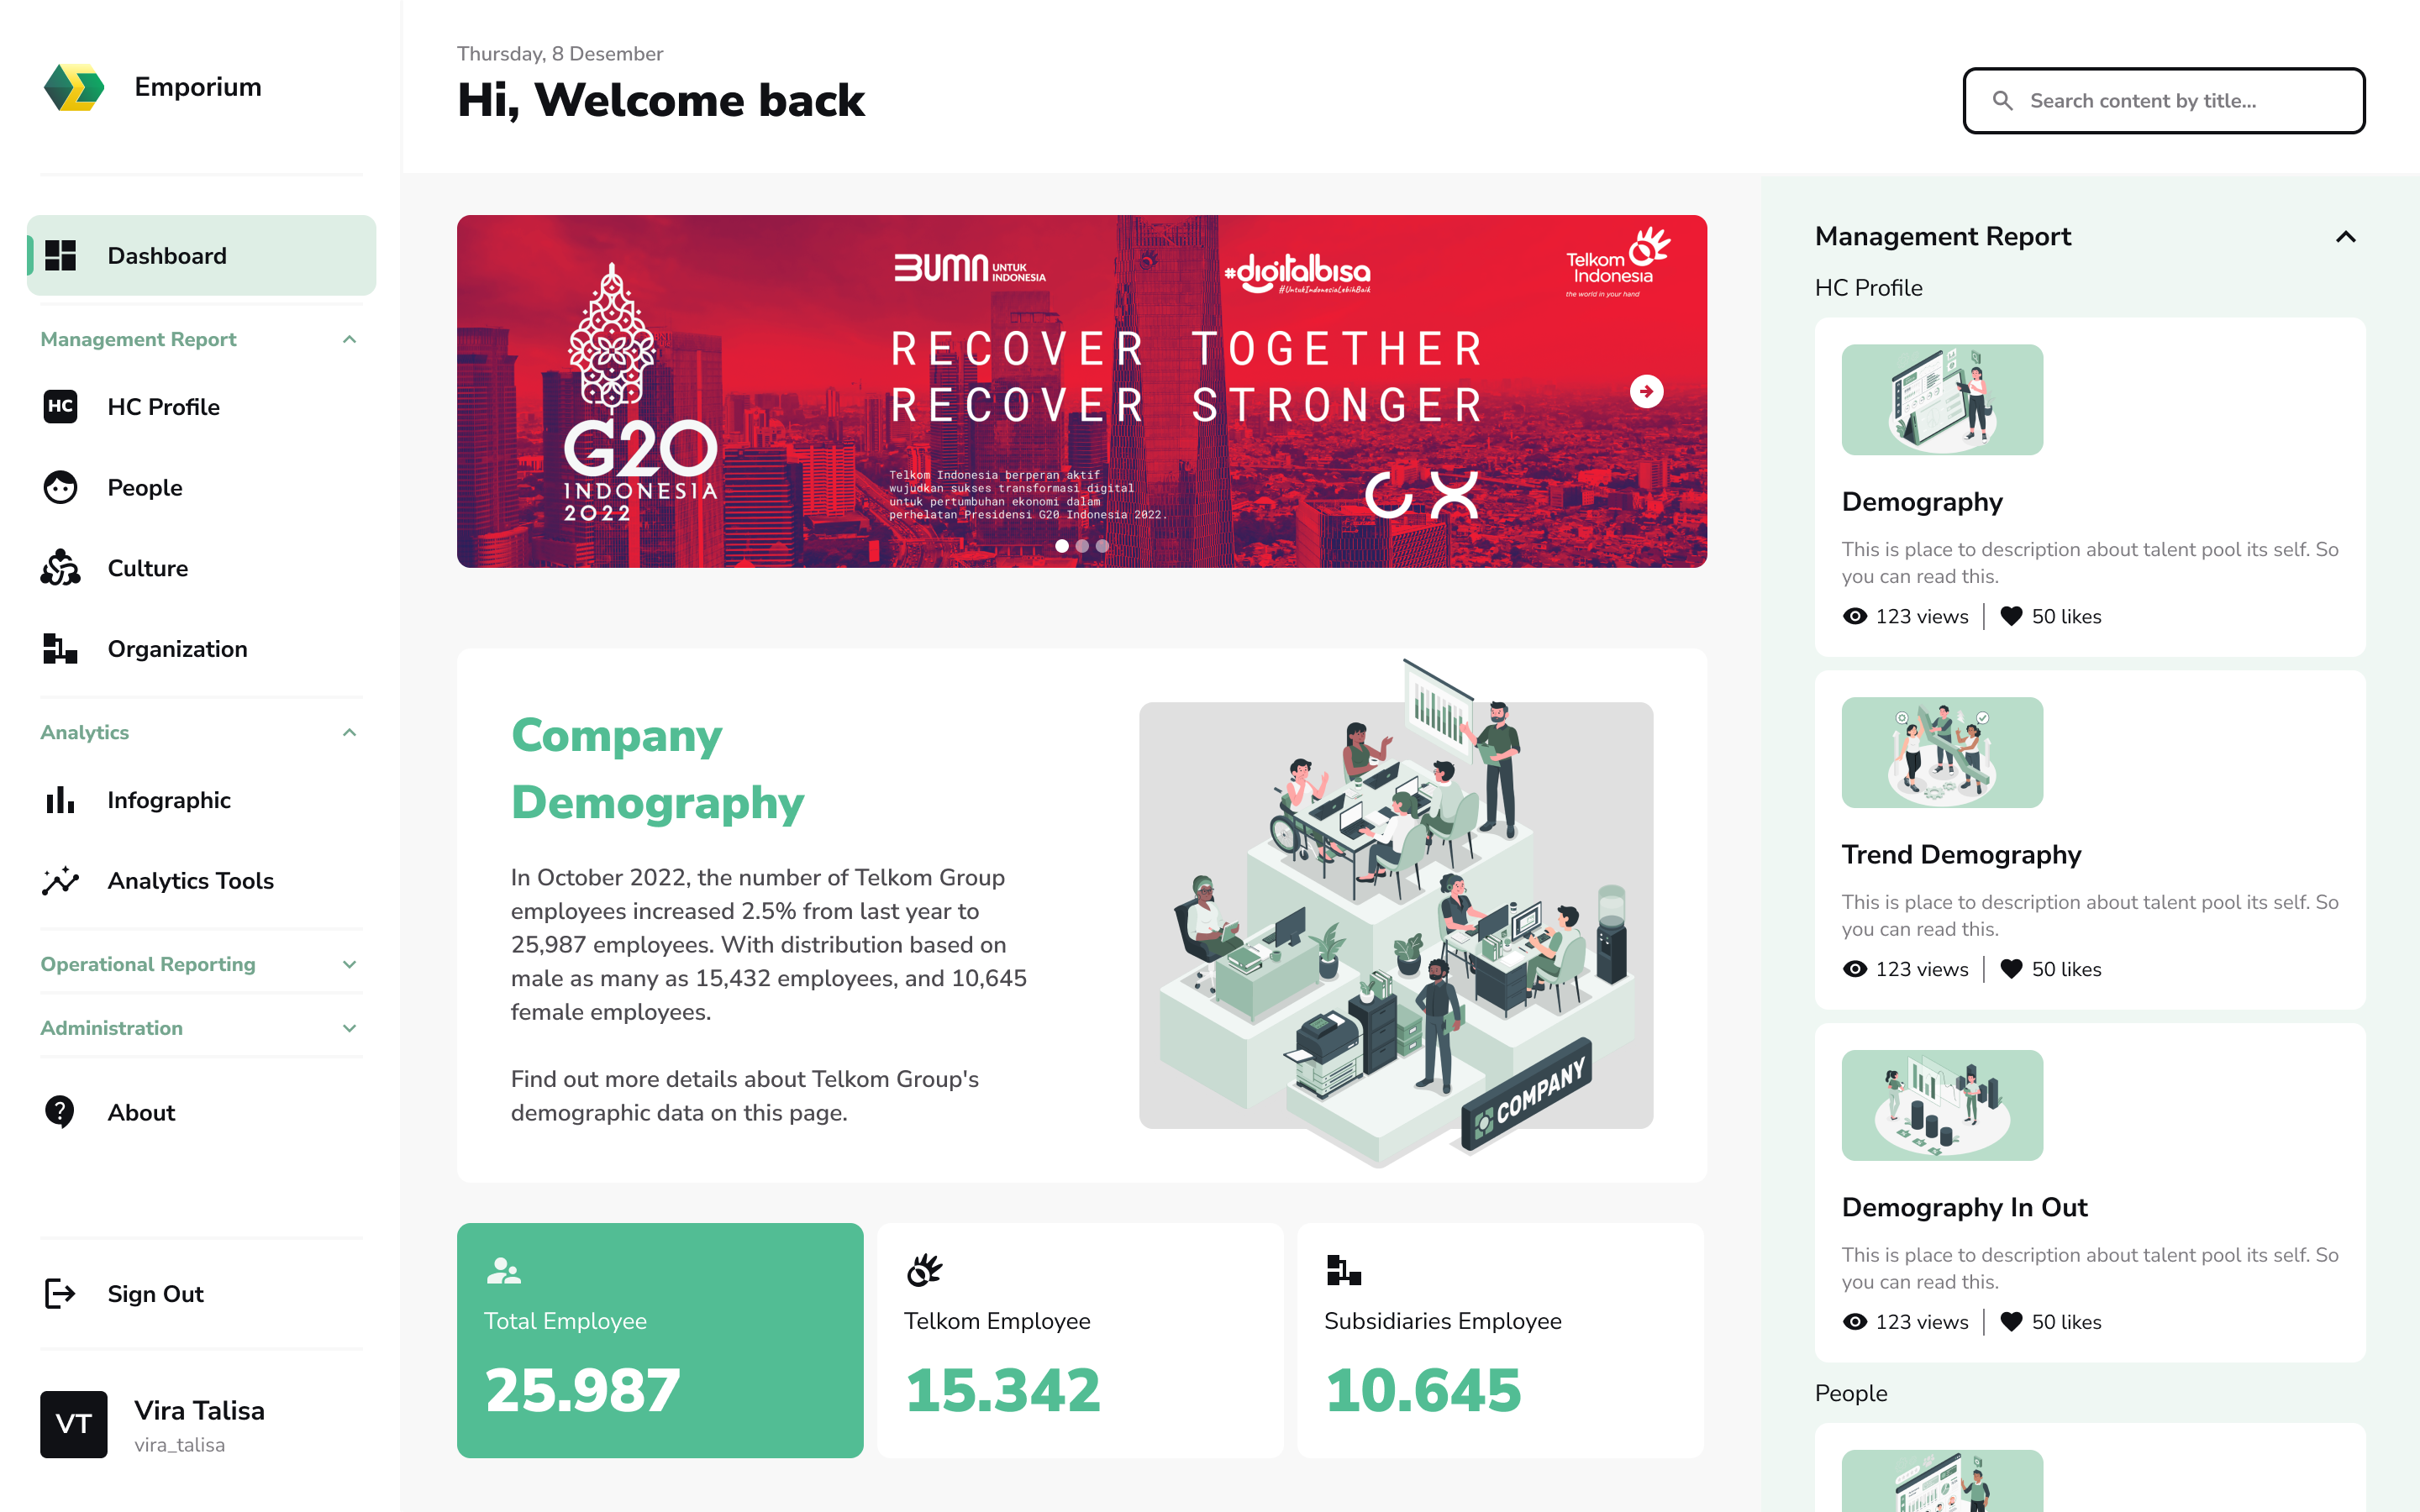
Main dashboard with company demography overview and management reports (Dummy Data)
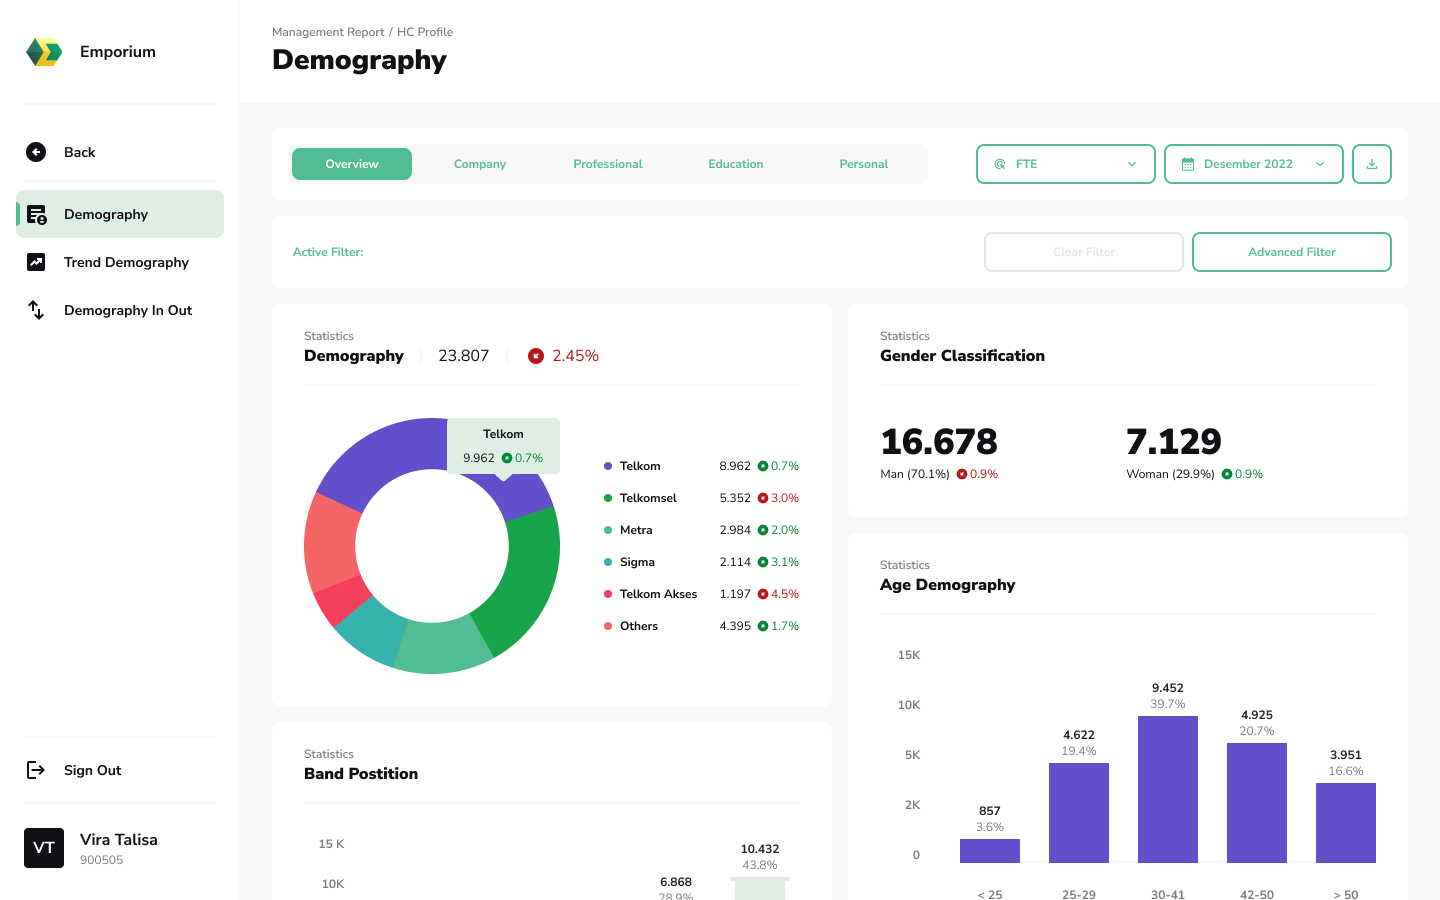
Detailed analytics page with interactive charts and filtering system (Dummy Data)
My Role
As a Freelance Full Stack Developer, I was responsible for translating Figma designs into pixel-perfect code, implementing dynamic charts with Highcharts, and collaborating with the backend team for seamless data integration.